Sewage data
Welcome to the Conham Bathing sewage data dashboard!
Here you can find historical data on CSO (storm overflow) usage in the lower Bristol Avon over May 2022-April 2024.
Our live data service is currently suspended.
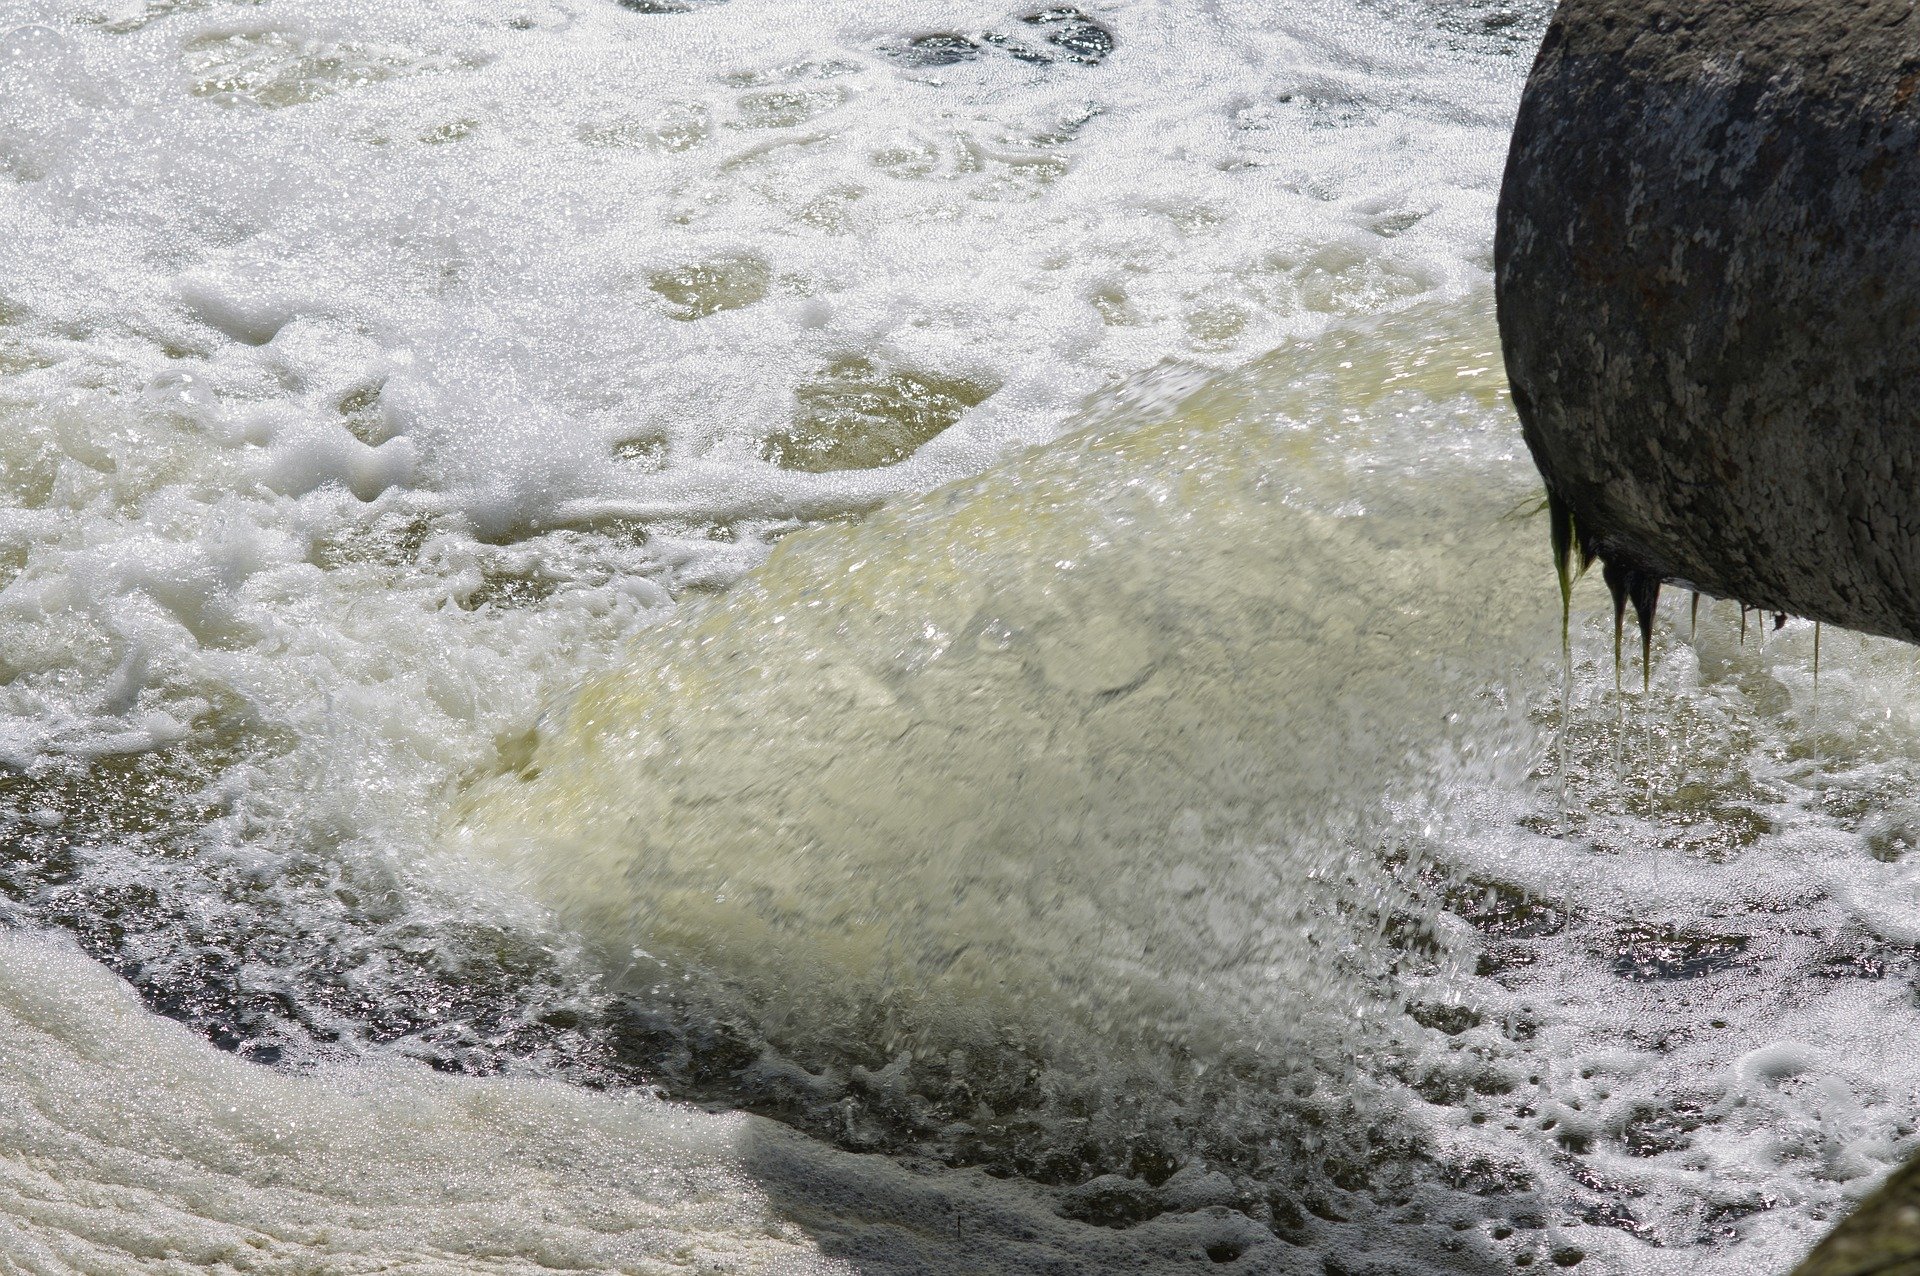
The data comes directly from Wessex Water and covers the following four CSO locations: Hanham (the nearest CSO to the Conham bathing spot), two CSOs in Keynsham, and Saltford.
Please note this page works better in desktop version.
Annual summary of all locations
This section contains a historical dataset of sewage spill data between 1 May 2022 and 5 April 2024, the date that the last CSO alert was received and our real-time CSO data service ended.
The calendar above is a summary of combined CSO spill activity. It shows spill durations, in minutes, of all 4 CSO locations combined. For example if we had 4 sites each spilling for 60 minutes in one day, it would show 240 minutes for that day. Each day is shaded blue, with the deepest blues indicating the days with the most spill activity. Hover your mouse over each day to see the combined spill activity for the day in minutes. Periods where data has not been collected are hatched.
The table below shows total spill durations (in minutes) per calendar month for each CSO location.
Please note:
the 2022 annual summary is partial, including data from 1 May 2022, when data collection began;
the 2024 annual summary is partial, including data up to 5 April 2024 when data collection ended.
2023
2022
2024
CSO map
Wessex Water has terminated its real-time CSO alert email notifications. Our service depends on this system, which means that we can no longer operate our CSO map.
We are looking into providing a replacement for this service. In the meantime, you can find real-time data on all the CSOs we cover by accessing the Wessex Water Coast and rivers watch map.